The Big Picture
“While mortgage rate volatility continues to cause buyer hesitation, the lack of for-sale homes is putting firm pressure on prices this spring, leading to above-average seasonal monthly gains and a rebound in home prices in most markets.” —Selma Hepp, Chief Economist for CoreLogic
Home Prices Are Rebounding Nationally
If you’re following the news today, you may feel a bit unsure about what’s happening with home prices and fear whether or not the worst is yet to come. If we take a year-over-year view, home prices have dropped, but that’s because we’re comparing to an unprecedented year when prices peaked well beyond the norm.
To avoid an unfair comparison to that previous peak, we need to look at the monthly data. And that tells a very different and much more positive story. Let's first take a look at what the national data tells us.
The graphs below use recent monthly reports from three sources to show the worst home price declines are already behind us, and prices are appreciating nationally.

Looking at this monthly view, we can see the past year in the housing market can be divided into two parts. In the first half of 2022, home prices were going up, and fast. However, starting in July, prices began to go down (shown in red in the graphs above). By around August or September, the trend started to stabilize. But, looking at the most recent data for early 2023, these graphs also show that prices are going up again.
The fact that all three reports show prices have been going up for three or more straight months is an encouraging sign for the housing market. The month-over-month data indicates a national shift is happening – home prices are rising again.
Craig J. Lazzara, Managing Director at S&P Dow Jones Indices, says this about home price trends:
“If I were trying to make a case that the decline in home prices that began in June 2022 had definitively ended in January 2023, April’s data would bolster my argument.”
Experts believe one of the reasons prices didn’t crash like some expected is because there aren’t enough available homes for the number of people who want to buy them. Even with today’s mortgage rates, there are more people looking to buy than there are homes available for sale.
Here’s How This Affects You
- Buyers: If you've been holding off on buying because you were worried the value of your home would go down, knowing home prices have bounced back should bring you some relief. It also gives you the opportunity to own something that usually becomes more valuable as time goes on.
- Sellers: If you've been waiting to sell your house because you were concerned about how changing home prices would affect its value, you don't have to wait any longer because the latest data suggests things are turning in your favor.
If you delayed your moving plans because you were concerned about home prices dropping, the latest data reveals the worst is already over, and prices are appreciating nationally.
Where are Mortgage Rates Are Heading?
According to Freddie Mac, the average 30-year fixed-rate mortgage peaked at 7.08% in the fourth quarter of 2022, and since then it’s primarily fluctuated between 6 and 7%. However, there are signs that rates could trend lower later this year.
Over the past year, mortgage rates have risen in response to economic uncertainty, inflation and the policy and decisions from the Federal Reserve. We know based on the latest reports that inflation, while still high, has moderated from its peak. This is an encouraging sign for the market and for mortgage rates. Here’s why. When inflation cools, mortgage rates generally fall in response. This may be why some experts are saying mortgage rates will pull back slightly over the next few quarters and settle somewhere around roughly 5.5 and 6% on average.
“Calmer inflation means lower mortgage rates, eventually,” wrote Lawrence Yun, Chief Economist at NAR, in a recent blog. “Mortgage rates slipping down to under 6% looks very likely toward the year’s end.”
Other leading economists agree. Fannie Mae forecasts an average rate of 6.0% during the fourth quarter of 2023 and 5.4% by the fourth quarter of 2024. The Mortgage Banker Association (MBA) offered an even more optimistic outlook, predicting rates to fall at a faster pace, with an average of 5.6% during the fourth quarter of 2023 and 4.8% by the fourth quarter of 2024.
In the meantime, if you are preparing to buy a home, new research by mortgage giant Freddie Mac indicates that it pays to shop around to multiple lenders to find the best rate.
Silicon Valley Housing Market
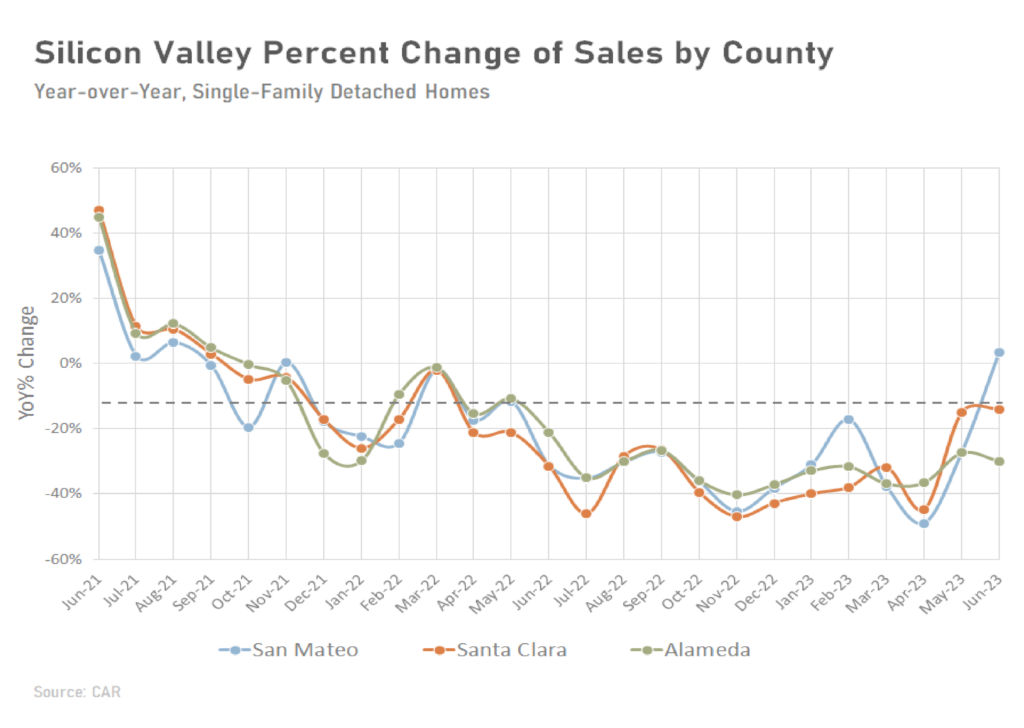
- Declines in sales continued to moderate in June, with Bay Area sales dropping 19.2% from a year ago, the first time in a year that sales dropped by less than 20%.
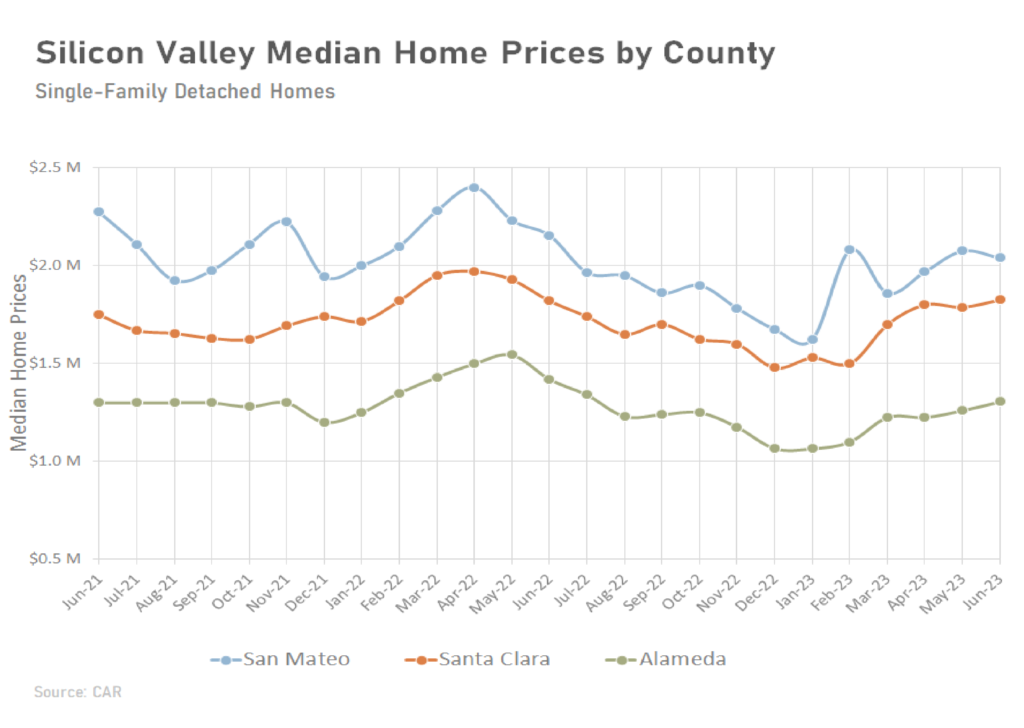
- Silicon Valley median price for single-family homes is lower than its value in June 2022, when the market was first showing signs of slowing. However, the monthly data shows that home prices are on the rise again in the second quarter of 2023.
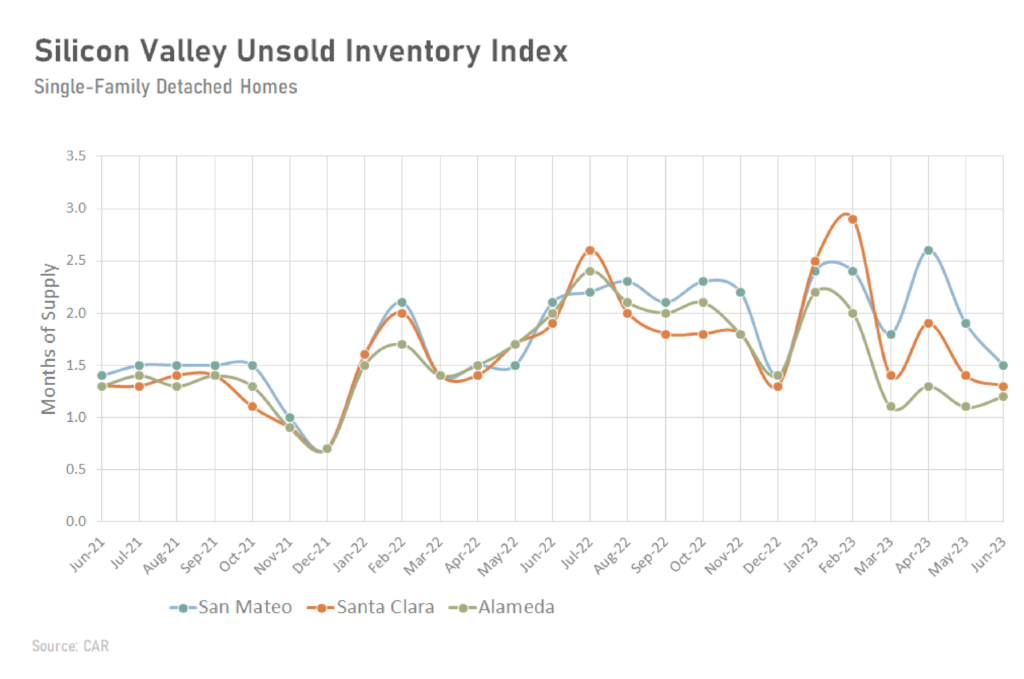
- Housing supply continues to be a challenge for buyers with inventory dropping to values we haven't seen since last year at this time.
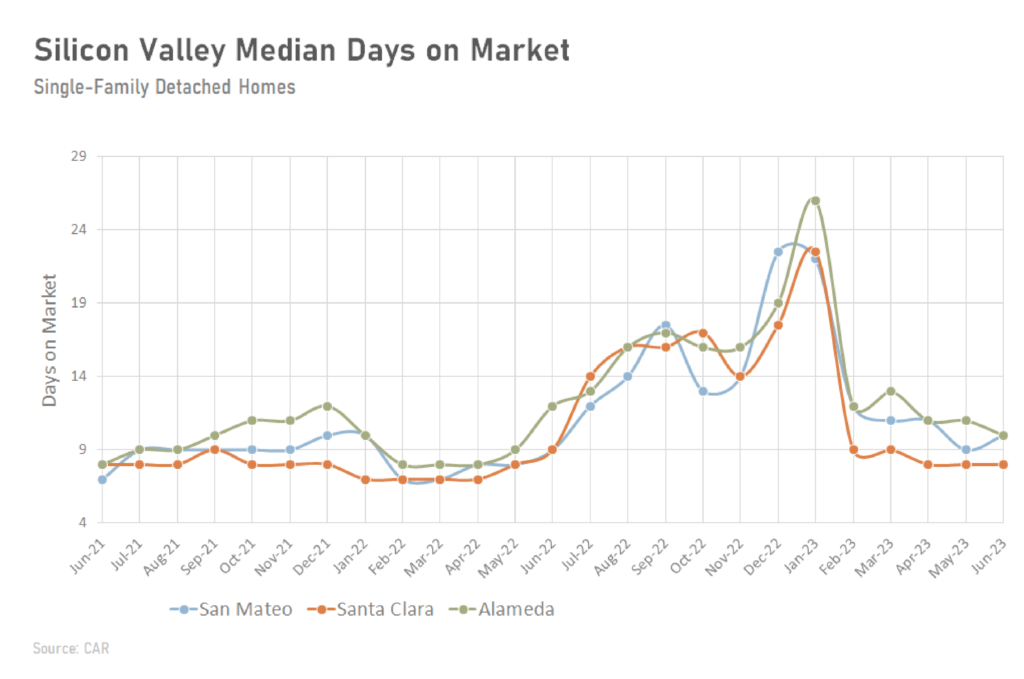
- The median number of days it took to sell a single-family home in the Bay Area dropped again to 13 days in June, exactly where it was one year ago.
As Goes the Nation? Have Silicon Valley Home Prices Turned the Corner?
When mortgage rates surged dramatically last year, rising from roughly 3% to 7%, many potential buyers felt a bit of sticker shock and decided to hold off on their plans to purchase a home. As a result, the demand from home buyers decreased, leading to an increase in the number of available properties for sale. However, as time has passed, that initial shock has worn off. Buyers have grown more accustomed to current mortgage rates and have accepted that the record-low rates of the last few years are behind us. This has led to stronger demand as buyers settle into where rates are right now.
Another interesting shift has occurred. The higher mortgage rates that had deterred buyers also made some homeowners hesitant to put their properties on the market. This reluctance was driven by the fact that those who had purchased homes recently or refinanced had secured mortgages at historically low rates of less than 5%. In contrast, the current average rates were closer to 7%, causing potential sellers to worry about taking on a much higher rate when buying their next property.
These factors contributed to a decline in inventory levels over the past six months or so. In fact today's inventory levels are as low as they were during the peak of the pandemic, and the market remains tight in terms of supply.
The combination of these trends has intensified competition among buyers and pushed home prices upward in Silicon Valley on a month-to-month basis. Experts are forecasting continuing growth in the coming year, but at rates more in line with historical price growth over the last several decades of 4-5%.
Year-to-date, median prices of single-family homes rose by 24% in Santa Clara and Alameda counties and 22% in San Mateo County. Condo prices were similarly up, with Santa Clara and San Mateo counties posting gains of as much as 23% and 15%, respectively, while Alameda County remained flat.
Unsold Inventory Index Indicates Continued Sellers' Market
The Unsold Inventory Index (UII) is a measure of the number of months it would take for all current homes on the market to sell at the current rate of sales. It is a key metric that measures the balance between housing supply and demand within a specific market. A high index value indicates an oversupply of homes, creating a buyer's market with more choices and negotiating power for potential buyers. Conversely, a low index value suggests a scarcity of available properties, resulting in a seller's market with limited choices and potentially higher prices as buyers compete for the available homes.
The UII measured less than two months in the second quarter of 2023 in most Silicon Valley cities, indicating a strong sellers’ market for both single-family homes and condos. The UII has trended downward since its peak in the first quarter due to increasing sales and fewer new listings coming onto the market. Alameda County recorded the sharpest year-over-year decline in active listings at 64.2% in June, with Santa Clara County close behind. According to the California Association of Realtors®, with mortgage rates expected to remain high in the next couple of months, Silicon Valley may not see any meaningful improvement in its housing inventory for the rest of the third quarter.
Sales-to-List Price Ratio Rises Above 100%
Sales-to-list-price (SL) ratio is an indicator of the negotiation power of home buyers and home sellers under current market conditions. The ratio is calculated by dividing the final sales price of a property by its last list price and is expressed as a percentage. A sales-to-list ratio above 100 percent suggests that the property sold for more than the list price, and a ratio below 100 percent indicates that the price sold below the asking price. The SL ratio continued to rise in the second quarter of 2023 as buyer competition intensified. In January 2023, the average seller received 96.8% of list price compared to 102.8% of list in June. As long as inventory stays tight as it is expected to through the end of the year, the market will remain competitive in the third quarter.
Historical
Statistics are from the California Association of Realtors® Housing Market Overview report and reflect existing single-family homes except where indicated. % change is Year-Over-Year.